Measuring object intensity and shape
Last updated on 2026-03-31 | Edit this page
Overview
Questions
- Once we have segmentation masks, what can CellProfiler measure from them?
- What is the difference between intensity measurements and shape measurements?
Objectives
- Use MeasureObjectIntensity to quantify fluorescence per nucleus, cell, and cytoplasm.
- Use MeasureObjectSizeShape to quantify area/shape descriptors for each object.
Measuring: turning segmentations into numbers
So far, we have been creating masks: pixels belonging to nuclei, cells, and cytoplasm. Masks are useful on their own for quality control, but the real power of CellProfiler is that it can turn masks into quantitative measurements.
In this episode, we will measure two broad classes of features:
-
Intensity features: “how bright is this object in a
given channel?”
- Example questions:
- Is actin intensity higher in treated cells?
- Do nuclei become brighter/dimmer in the DNA channel?
- Example questions:
-
Size and shape features: “what is the geometry of
this object?”
- Example questions:
- Do cells spread out or shrink?
- Do nuclei become larger or more elongated?
- Example questions:
MeasureObjectIntensity: measuring fluorescence per object
Add the MeasureObjectIntensity module to your
pipeline.
This module measures per-object intensity statistics for one or more images. For example, it can quantify the DNA stain in the nucleus, or the actin stain intensity in the cytoplasm.
Challenge
What channel should be measured in what part of the cell? For example, should we quantify DNA signal only in the nucleus, or everywhere (nucleus, cytoplasm, whole cell)? Discuss with your neighbor.
The simplest setup is to measure all channels in all parts of the cells and decide which measurements to interpret down the line. Perhaps surprisingly, this is the approach frequently chosen in high-throughput experiments: measure everything, ask questions later. And indeed, one can envision scenarios where measuring e.g. DNA in the cytoplasm may prove useful if DNA leaks through the nuclear envelope due to environmental stress.
That said, if you have a narrow research question and an idea of where to look for changes in cell morphology, then only measuring the correct combination of channel and cell components will be the right approach.
To set this up in CellProfiler, for
Select the objects to measure select:
Nuclei_FilteredCellsCytoplasm
Note: these names may differ, depending on what you called them in
previous modules. We will not use the nuclei created in
IdentifyPrimaryObjects, because we filtered them in
IdentifySecondaryObjects to only contain nuclei of cells
that are not touching the image boundary.
Then, select all channels in Select images to measure,
unless you would like to only measure some of the channels. Finally, run
the module in test mode and look at the output.
Challenge
Let’s see whether the DNA intensity is higher in the cytoplasm or the
nucleus. Using the table that the module outputs in test mode, look for
a row with DNA - Cytoplasm - MeanIntensity and read off the
value in the Mean column. Then repeat this for
DNA - Nuclei_Filtered - MeanIntensity. What do you
observe?
Depending on your segmentation settings and which image you are using to test, the mean DNA intensity is about 3-4x higher in nuclei than in the cytoplasm, as you would expect.
MeasureObjectSizeShape: measuring geometry
Beyond fluorescence intensities, it is common to measure shape descriptors of cells. Example measurements include:
- area
- perimeter
- eccentricity / elongation
- compactness
Once again, we add the module (MeasureObjectSizeShape)
and select our objects to measure in as before. For this workshop,
disable Zernike and advanced features, as they slow down CellProfiler,
which can be annoying while building the pipeline.
CellProfiler measures many things - including some with names that
most will never have heard of. The helps a lot with deciphering the
measurement names. For example, for eccentricity it
contains this helpful image: 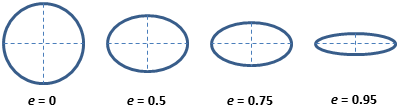 Which shows that eccentricity will be higher for elongated cells.
Step 3: Sanity check measurements
When building a workflow, it is worthwhile checking outputs at each step. For measurements this can be a bit harder than with segmentation, but one of the things we can check is the cytoplasm/nucleus area ratio. We have now seen many example images of these MCF7 cells and could venture a guess that the cytoplasm occupies more space than the nuclei (in 2D).
Calculate the cytoplasm/nucleus ratio
Run the module in test mode and look for the Area
feature for Cytoplasm and Nuclei_Filtered (or
equivalent names in your pipeline). This feature describes the average
number of pixels occupied by the cytoplasm/nucleus. Now calculate the
ratio of the cytoplasm to nucleus area.
The cytoplasm occupies about 3-4x more space than the nucleus. Again, depending on your segmentation settings, your result may differ. This is in line with our observations from images of the cells.
Exporting measurements
So far we have created segmentation masks and computed measurements
(intensity and size/shape). To use these measurements outside
CellProfiler (e.g. in R, Python, or Excel), we need to export them to
files. One standard way to do this is the
ExportToSpreadsheet module.
Add the ExportToSpreadsheet module. For this workshop,
the default settings are fine. The most important thing is that:
- the module exports object-level measurements (for
Nuclei_Filtered,Cells, andCytoplasm), and - you need to know where the files are written to.
Challenge: export your measurements
- Add ExportToSpreadsheet at the end of your pipeline.
- Run the pipeline (not in test mode, but by clicking
Analyze images) - Find the exported files on disk.
Questions: - What file format(s) were produced
(e.g. .csv)? - Do you get separate files for
Nuclei_Filtered, Cells, and
Cytoplasm? - Open up one of the files. Can you identify at
least one column coming from intensity measurements and one coming from
shape measurements?
With default settings, CellProfiler typically exports one spreadsheet per object type (e.g. one for nuclei, one for cells, one for cytoplasm), plus one for image-level measurements if any were computed.
Open one of the exported spreadsheets and look for column names such as:
-
Intensity_MeanIntensity_*orIntensity_IntegratedIntensity_*(fromMeasureObjectIntensity) -
AreaShape_Area/AreaShape_Perimeter/AreaShape_Eccentricity(fromMeasureObjectSizeShape)
If you cannot find the files, check the
Output file location setting in
ExportToSpreadsheet and re-run the pipeline.
Tip: run on a subset first
When developing a pipeline, it’s often faster to run on a small subset of images first to confirm that exports look correct. Once you’re satisfied, run the pipeline on the full dataset. In this exercise, you have only been provided with a few images so this does not apply, but it will make a big difference when dealing with hundreds of images.
Conclusions
We have now added measurement modules to compute:
- per-object fluorescence intensities (per nucleus, cell, cytoplasm)
- per-object morphology features (size and shape)
These features are the raw material for downstream analyses like comparing treated vs control populations, building morphological profiles, or training classifiers.
Help
Did you get stuck with one of the steps? Download a working version of the pipeline here:
If you are using Firefox, you have to right click the button and
select Save Link As....
After downloading the pipeline, you can compare it to yours for
troubleshooting. To do so, first open a new CellProfiler window. Then,
import this pipeline in CellProfiler by clicking on File
> Import > Pipeline from File.
- MeasureObjectIntensity quantifies fluorescence per object; choose objects and channels deliberately.
- MeasureObjectSizeShape quantifies morphology; disable Zernike/advanced features to iterate faster.