napari-colocalization
Under construction - pre-alpha
APIs, UI, and outputs may change without notice. Not recommended for production analysis yet; use at your own risk and please report rough edges via the issue tracker.
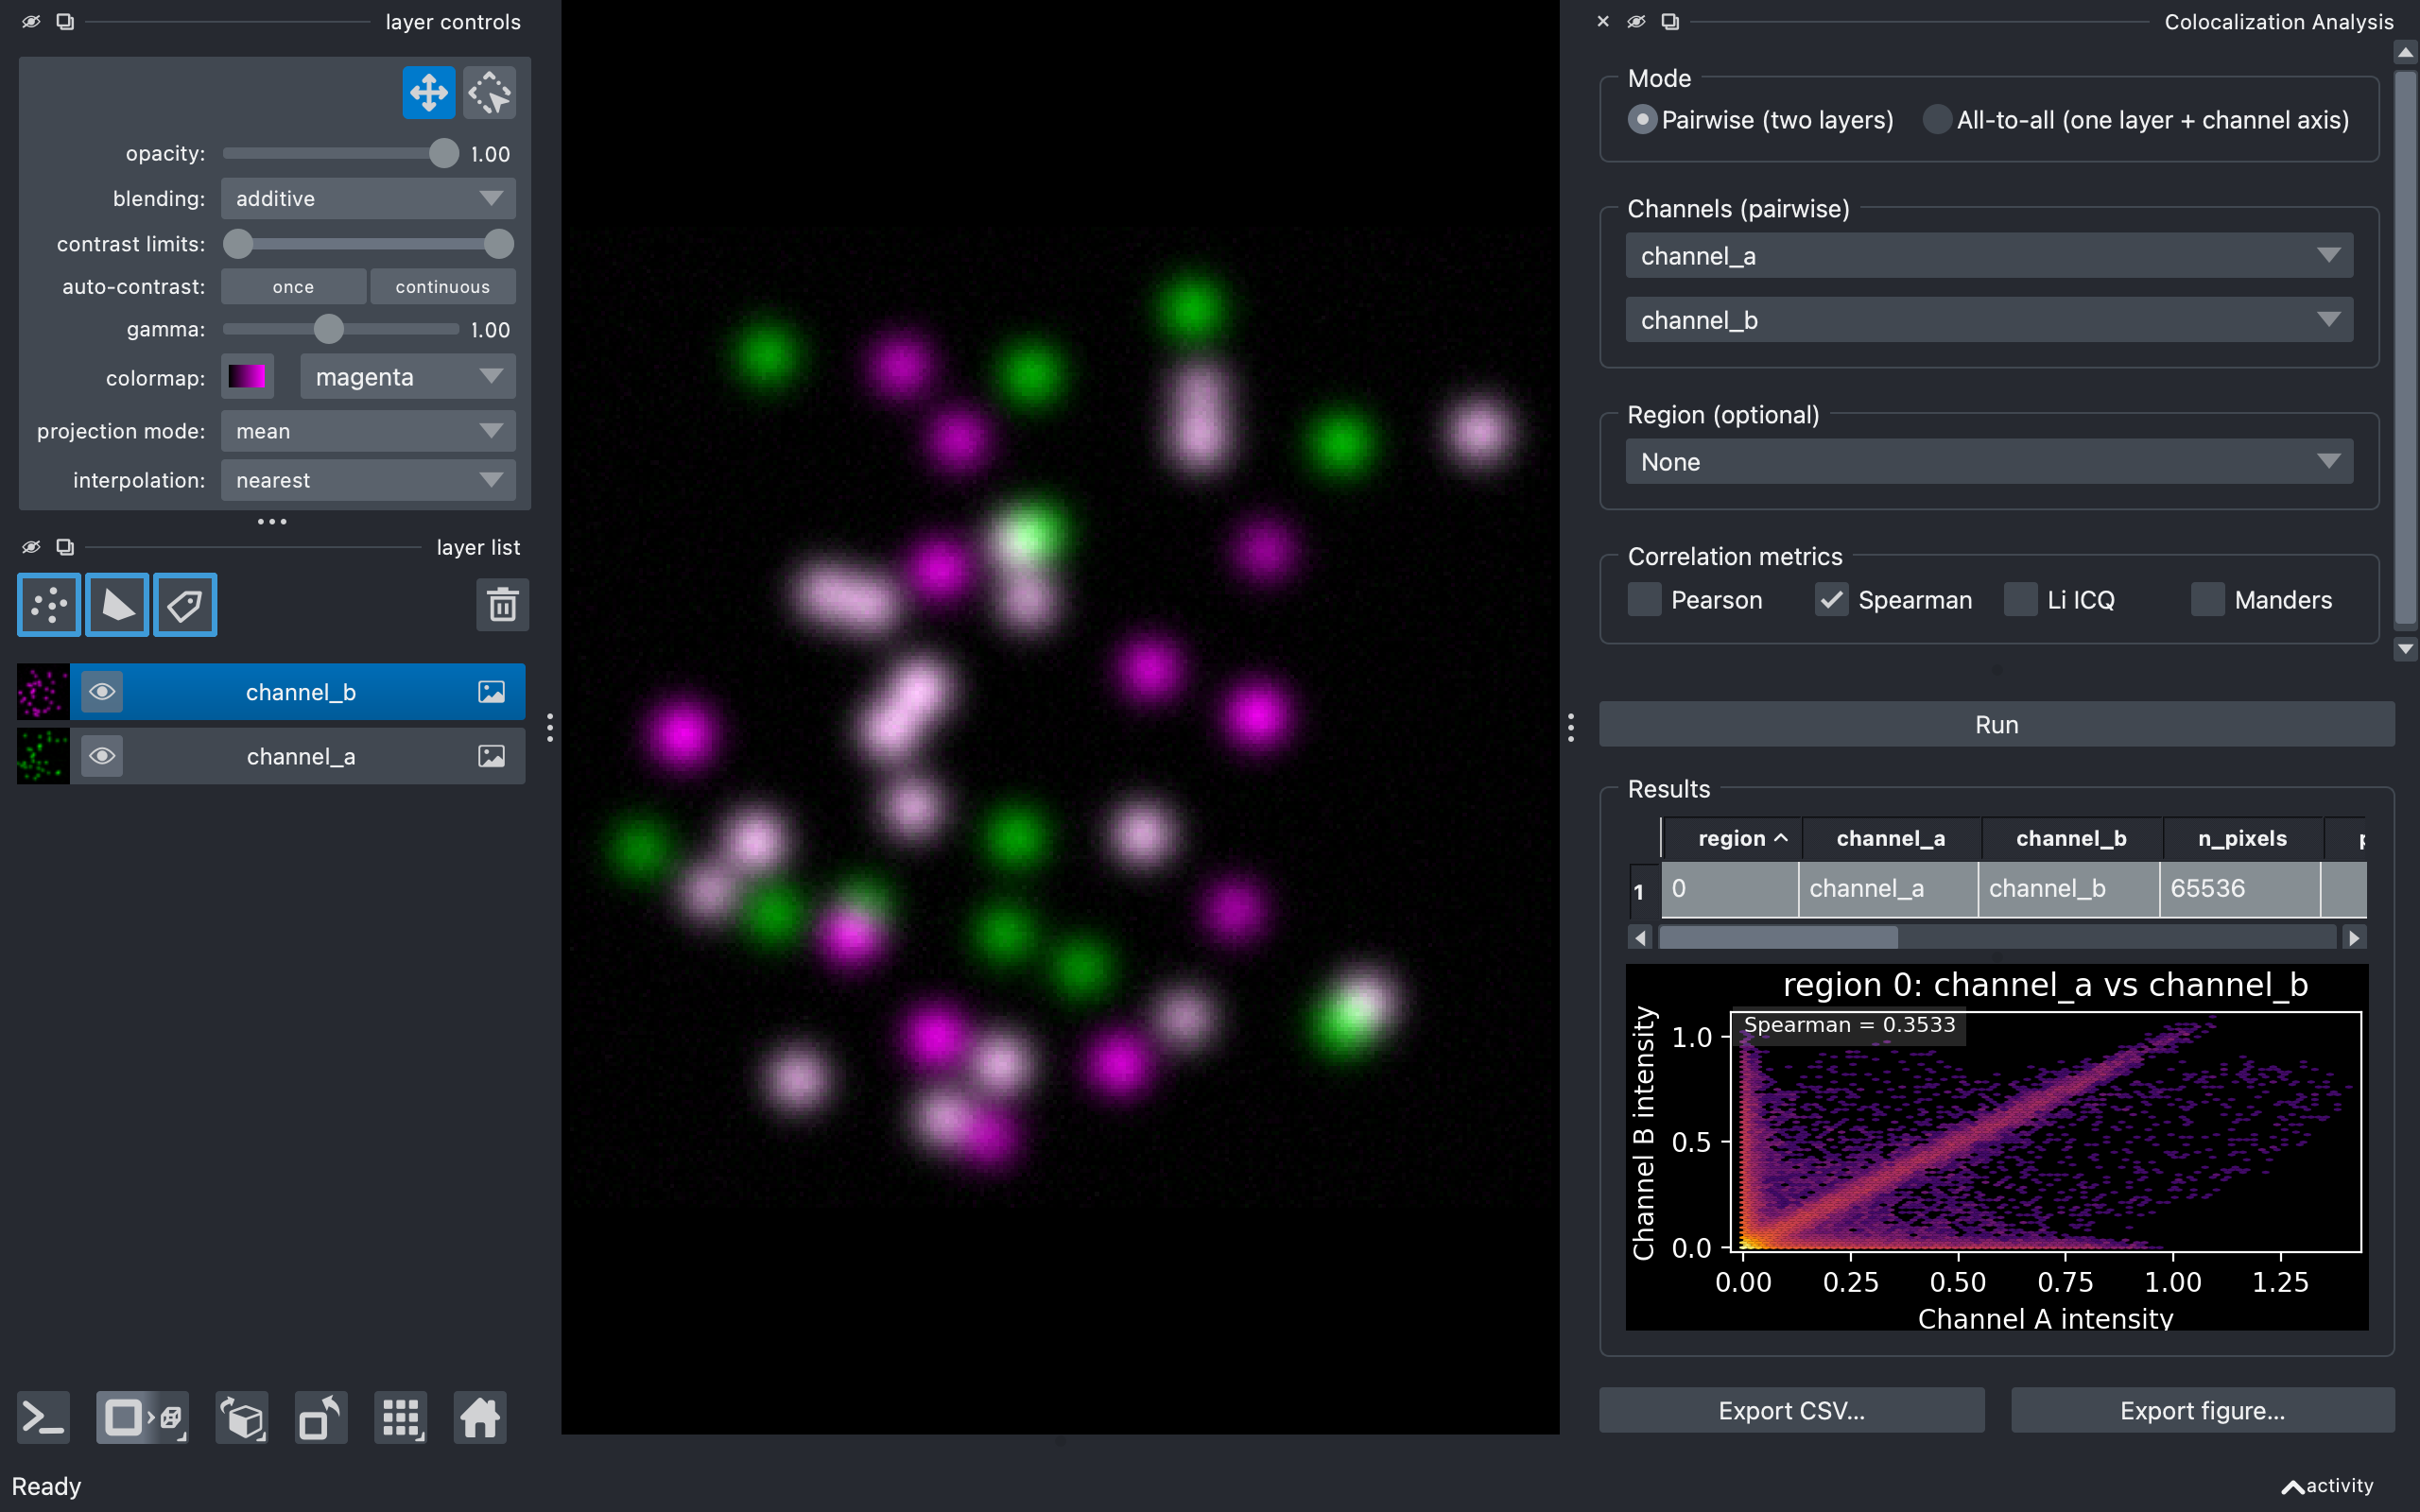
Interactive intensity-colocalization analysis for napari. Pick two channels (or one multi-channel image), optionally restrict the analysis to a region drawn as shapes or labels, choose your metric, and get a results table plus an intensity-vs-intensity density plot - all without leaving napari.
Features
- Five colocalization metrics: Pearson (PCC), Spearman rank (SRCC), Li Intensity Correlation Quotient (ICQ), Manders' overlap coefficient with split coefficients (r, k1, k2), and Manders' coefficients M1/M2 (MCC).
- Pairwise or all-to-all mode, 2D and 3D, with optional per-Z-slice analysis (one row per plane).
- Region-restricted analysis via a Shapes or Labels layer - each non-zero region is reported on its own row.
- Manders thresholds: Costes auto (orthogonal-regression bisection, matched to Fiji Coloc 2), a per-channel auto-threshold (Otsu, Li, Triangle, Yen, Mean, IsoData), or Manual.
- Diagnostics tab: Costes randomization significance test, Van Steensel cross-correlation function, and Li intensity correlation analysis.
- Object-based tab: centre-particle coincidence and object overlap, with centroid Points and nearest-neighbour Vectors drawn into the viewer.
- Interactive results: in-widget table, cytofluorogram of the selected row (with optional fixed axes), and viewer highlighting / output layers.
- CSV export of the current table, plus figure export of the plots.
Installation
If napari isn't already installed, install both at once:
Where next?
- Usage guide - every control in the widget, in order.
- Metrics - what the metrics mean, when to use which, how the Costes auto-threshold works, and the diagnostics.
- Python API - calling the pure-compute layer (
pearson,spearman,li_icq,manders,overlap,costes_threshold,analyse_pairwise/analyse_all_to_all, plus the_diagnosticsand_objectsfunctions) from scripts or notebooks. Reference is auto-generated from the source docstrings.
Source code
The plugin lives at github.com/DBI-INFRA/napari-colocalization. File issues or feature requests on the tracker there.